DAta Research (DAR - در) Lab - Pakistan
Karachi Bus Network
Karachi, a megacity facing significant transportation challenges due to an increase in motorized vehicles and insufficient transport policies, has a public transport system that operates suboptimally, affecting both coverage and accessibility. The recent introduction of Bus Rapid Transit (BRT) systems (partially operational), aims to mitigate these problems by offering safe, high-quality transport services with dedicated lanes for improved efficiency.
The current lack of comprehensive data on Karachi’s bus network makes it difficult to evaluate the system’s efficiency, coverage, and impact along with gender-specific mobility patterns. This dataset aims to bridge this gap, providing essential insights to enhance public transport planning, address accessibility issues, and guide future policy decisions for a more efficient and inclusive transportation system in Karachi.
Methodology
We compiled route data for 76 public buses in Karachi, encompassing both Bus Rapid Transit (BRT) and minibusses. The data was sourced from the Travel Culture and HamariWeb websites available on the internet, providing detailed bus routes for each vehicle. Using Google Maps, we further extracted the longitude and latitude coordinates for each bus stop along these routes. This dataset offers a comprehensive overview of the public transit network in Karachi, serving as a foundational resource for further analysis.
The raw data underwent a thorough cleaning and standardization involving addressing inconsistencies, eliminating errors, and ensuring uniformity in node and edge attributes. By standardizing the data, we created a cohesive and analyzable format, allowing for the integration of diverse data sources.
The cleaned route data was used to construct public transit networks, with bus stops represented as nodes and bus routes as edges. QGIS was utilized for geo-referencing bus stops to provide geospatial context to the network models.
Potential Use Cases
-
Network Analysis: Researchers can analyze the network’s structure, connectivity, and efficiency to identify key routes, hubs, and bottlenecks. This analysis can inform route optimization, service planning, and infrastructure development to enhance the public transport system’s performance.
-
Accessibility Assessment: Policymakers can evaluate the network’s coverage, accessibility, and equity to identify underserved areas and improve residents’ mobility options. This assessment can guide service expansion, fare integration, and route adjustments to enhance public transport accessibility.
-
Spatial Planning: Urban planners can integrate the network data with demographic, land use, and infrastructure datasets to develop comprehensive transport plans. By analyzing the network’s spatial distribution, connectivity, and demand patterns, planners can design sustainable, inclusive, and efficient public transport systems that meet the city’s evolving
Data Repository
The data is available at the following link: Karachi Bus Network
![]()
File Descriptions
The dataset is available in CSV and graphml formats, facilitating easy integration into network analysis tools for further exploration and visualization. The data is structured to support spatial analysis, enabling researchers and policymakers to evaluate the public transport system’s performance and identify areas for improvement.
The dataset comprises the following files:
karachi_bus_network_edge_list.csv: Contains the edge list of the Karachi bus network, including the source and target nodes, route ID, and route name.karachi_bus_network_node_data.csv: Contains the node data of the Karachi bus network, including the node name, latitude, and longitude.generate_bus_network.R: R script used to generate the bus network in graphml format from the edge list. The script requires the igraph package to be installed.karachi_bus_network.graphml: Graphml file containing the Karachi bus network data. The file can be imported into network analysis tools for further analysis. The network has the following attributes.
| Attribute | Type | Description |
|---|---|---|
| id | node attribute | Unique identifier for each node |
| name | node attribute | Name of the node (bus stop) |
| longi | node attribute | Longitude of the node |
| lati | node attribute | Latitude of the node |
| bus_name | edge attribute | A collection of names of the bus route |
Data Summary
The dataset contains information on 76 public buses in Karachi (including BRT and minibuses). The network consists of 572 nodes and 1490 edges, providing a comprehensive overview of Karachi’s public transit system. The dataset includes detailed route information for each bus, enabling in-depth analysis of the network’s efficiency, coverage, and accessibility.
We analyzed key network metrics to characterize the structure and connectivity of the Karachi bus network. These metrics provide a quantitative overview of the network’s overall layout, accessibility, and interconnectedness. The table below summarizes these properties, offering insights into the network’s complexity and efficiency.
| Network Metric | Value |
|---|---|
| Nodes (bus stops) | 572 |
| Edges (connection between bus stops) | 1139 |
| Average Degree | 3.98 |
| Density | 0.0035 |
| Diameter | 25 |
| Average Path Length | 8.08 |
| Clustering Coefficient | 0.14 |
The network is sparse as it has a low density of 0.0035 (fraction of total edges). The diameter of 25 and average path length of 8.08 highlight that while some stops are far apart. The clustering coefficient of 0.14 reveals modest local connectivity, suggesting some clustering among nearby stops but limited neighborhood interconnectivity. These metrics collectively reflect a network that is extensive but lightly interconnected.
We have conducted spatial mapping of Karachi’s bus network, identifying the precise latitude and longitude coordinates for each bus stop. Using these coordinates, we visualized the bus stops on a map: orange markers represent stops for minibuses, green markers indicate stops for Bus Rapid Transit (BRT), and red markers denote combined stops where both types of buses are accessible. This visualization offers a clear and accessible overview of the city’s transit system, enabling users to observe the geographic distribution of bus stops.
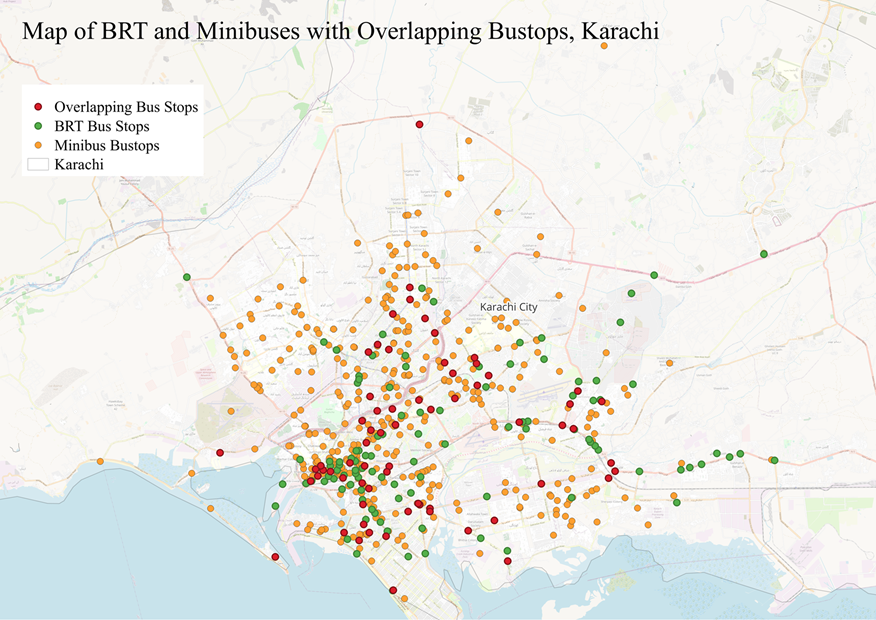 (Map of BRT and Minibus Stops in Karachi)
Limitations
This dataset has certain limitations due to data availability from secondary open sources. Some routes captured may no longer be operational, as minibuses have seen significant reductions in service due to the introduction of other transportation modes, such as local rickshaws, known locally as “Chingchi”. Additionally, obtaining precise geographical coordinates for all bus stops proved challenging, impacting the accuracy of spatial mapping. Accurate and updated location data would allow for finer geospatial analysis, enabling deeper insights into route optimization and accessibility.
License
This dataset is licensed under the Creative Commons Attribution 4.0 International License.
Cite as
@dataset{
  author       = {Pasta, Muhammad Qasim and
                  Khan, Moid Raza and
                  Aslam, Fatima},
  title        = {Karachi Bus Network},
  month        = oct,
  year         = 2024,
  publisher    = {Data Research Lab Pakistan},
  doi          = {10.5281/zenodo.13951512},
  url          = {https://doi.org/10.5281/zenodo.13951512}
}
Team Members
- Muhammad Qasim Pasta(Corresponding Member)
- Moid Khan (Student Researcher)
- Fatima Aslam (Student Researcher)